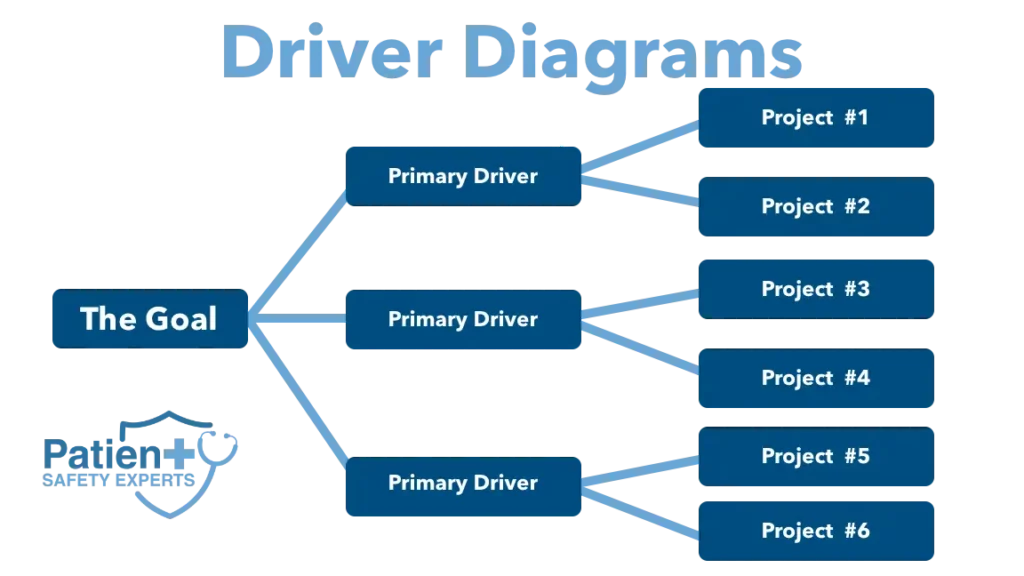
Driver diagrams are widely used for performance improvement. They are a visual display of a team’s theory of which factors “drive,” or contribute to, the achievement of a project aim. This visual display of a team’s shared view is used to communicate this vision to a range of stakeholders where a team is testing and working. A driver diagram shows the relationship between the overall aim of the project and, the primary drivers (sometimes called “key drivers”) that contribute directly to achieving the aim, the secondary drivers that are components of the primary drivers, and specific change ideas to test for each secondary driver.
The driver diagram allows an overwhelmingly large project to be broken down into actionable steps that can be then acted upon by the various stakeholders.
The resources on this page are intended to provide foundational concepts to the driver diagram and describe how to:
- Construct a key driver diagram, updating the diagram as indicated by system changes
- Apply the key driver diagram to a performance improvement project, using the diagram to plan and execute small tests of change
The Origins of the Driver Diagram
The Driver diagram’s usefulness has its roots in W. Edwards Deming’s teachings describing a System of Profound Knowledge that is necessary for successful improvement.
The four elements of this system are:
- The appreciation of the system in which the improvement is to be made,
- The understanding of variation
- The psychology of behaviors, and
- The theory of knowledge (Deming et al, 1994).
It is this theory of knowledge that driver diagrams aim to bring to life so that the theory can be tested in a series of successive improvement cycles, referred to as PDSA (Plan Do Study Act) cycles.
Driver diagrams are based on the theory that a small and manageable number of factors can be identified to drive almost any performance improvement.
This concept was even embraced as a component of global influencing strategy, as described by Patterson and colleagues in the book “Influencer – The Power to Change Anything”. They identify that changing only a few behaviors can result in solving some of the toughest and most complex problems.
While PDSA cycles have been widely described as a mantra for performance improvement, many believe that without an understanding of all four elements of Deming’s System of Profound Knowledge, performance improvement limited to PDSA cycles can be challenging and discouraging in its impact. The modern Model for Improvement (Gerald et al, 2009), as extensively described and taught by the Institute for Healthcare Improvement (IHI) brings additional concepts to the table. It incorporates the PDSA cycle and three questions to focus on improvement. These three questions direct improvement teams’ attention to all the components of Deming’s System of Profound Knowledge. By calling out the specific aim of the improvement effort with the question of “What are you trying to accomplish?: the model for improvement addresses motivation and takes into account the relevant psychology. By focusing on measurement with the question “How will you know a change is an improvement?”, it introduces the study and analysis of variation. By asking the question “What changes can you
make that will result in an improvement?”, it insists that teams grapple with the theory of improvement, and identify the actions, behaviors, and processes that need to be addressed in effecting positive change.
The driver diagram represents the improvement team’s shared theory of knowledge. It is a tool to identify which hypotheses the team will test in their improvement efforts. The driver diagram should incorporate and integrate the team’s understanding of the system they wish to improve, knowledge of available baseline data, behavioral and motivational considerations, as well as process and technical knowledge.
The team’s shared theory of knowledge is best developed by including members representing the entire team affected. Concerted efforts should be made to include a comprehensive view of patient-facing personnel. Inputs into the development of the shared theory of knowledge around the system they wish to improve include knowledge from experts, relevant beliefs of team members regarding the team, workflow, and motivational factors, as well as published evidence. It is critical that sufficient time and effort is devoted to developing the team’s theory of knowledge by consensus. This represents their shared understanding and agreement on the nature of the problem to be solved and the factors that need to be addressed to improve the outcome of interest.
Because the driver diagram is also a visual tool it can be very useful in communicating the “why” of the needed changes, then thereby influencing behavior of team members. The diagram is represented as a series of boxes and arrows outlining the key (primary) and secondary drivers (often identified as actions) that are thought to influence the outcome directly (primary drivers) or indirectly (by acting on primary drivers).
Examples of Driver Diagrams As They Relate to Publicly Reported Quality Metrics
Many publicly reported quality and patient safety metrics depend as much on accurate documentation and coding as they are a result of best clinical practices. Therefore driver diagrams intended as tools to improve such metrics need to incorporate these important drivers of outcomes such as hospital-acquired infections, severe pressure ulcers, falls with harm or any of the AHRQ patient safety indicators or hospital-acquired conditions.
Our improvement teams have successfully included structural elements in the concurrent review and documentation process, as well as practice changes to reduce harms such as iatrogenic pneumothorax, postsurgical sepsis, CLABSI, CAUTI, hospital-acquired severe pressure ulcers, post-procedural retained foreign objects, postoperative dehiscence as well as accidental puncture and lacerations. The reader is referred to the individual chapters for these harms, as well as the chapter on performance improvement based on case review and analysis of outcome metrics
An example is our driver diagram for severe hospital-acquired pressure ulcers. The primary drivers of PSI-3 are (1) early recognition of the skin lesion, (2) preventive measures such as frequent turning and moisture control (3) measures to prevent progression of the lesion, and (4) accurate documentation. It is easily seen that drivers 1-3 relate, again, to clinical practice, while driver 4 aims at optimal accuracy in describing and diagnosing the skin lesion.
Figure ___: PSI-3 Driver Diagram\
An Introduction to Driver Diagrams
How to Use a Driver Diagram
Useful links for a more in-depth exploration:
- W. Edwards Deming’s System of Profound Knowledge. This system provides a highly integrated framework of thought and action for any leader wishing to transform an organization operating under the prevailing system of management into a thriving, systemically focused organization. If you want a quick introduction, his book, The New Economics, presents a detailed explanation of his System of Profound Knowledge.
- The IHI Website on Driver diagrams. This page is a little lacking but overall the IHI does tremendous work.


